Audience and Product Data can be presented in a number of ways.
It is safe to say there will be a question on the exam paper where you have to read and interpret audience data, so it is important that you feel confident doing so.
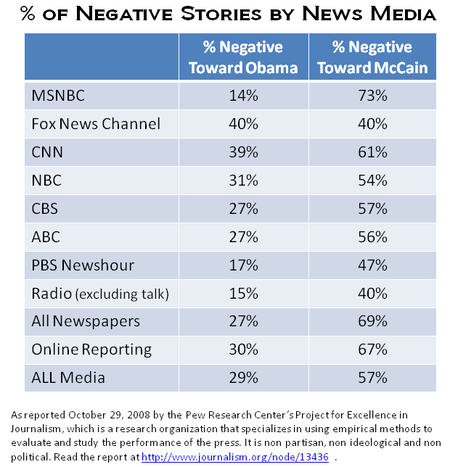
Data is commonly presented using charts, graphs or tables
Pie chart

Bar chart


Line Graph

Venn Diagram

Table
No comments:
Post a Comment